
The average North Somerset home was £313,638 in July 2026, up 3.8% while England managed 1.1%. Growth has halved since June. Prices by type, town and buyer.
A year ago North Somerset was one of the weaker housing markets in the west of England. In the year to September 2025 the average home here got 3.3% cheaper. By June 2026 the same measure was up 7.6%, the fastest annual growth of any local authority area in the South West. In July it halved, to 3.8%.
That is still well ahead of England and of the South West as a whole. This page has what the average is now, how it moved, what you pay by property type, and how North Somerset compares with Bristol, Bath and the wider region.
The headline figure
The average home in North Somerset sold for £313,638 in July 2026, according to the UK House Price Index published by HM Land Registry and the ONS. That is 3.8% up on July 2025, when the average was £302,146, a gain of £11,492 in twelve months. It is also £1,362 below June, the first monthly fall since February. Of the 26 South West local authority areas with a July figure, only Gloucester grew faster.
| Area | Average price | Change in the year |
|---|---|---|
| North Somerset | £313,638 | +3.8% |
| Bath and North East Somerset | £409,045 | −0.7% |
| City of Bristol | £352,262 | +2.1% |
| Somerset | £282,062 | +3.1% |
| South West | £302,298 | −0.2% |
| England | £293,479 | +1.1% |
North Somerset sits between Bristol and Somerset on price, which is what you would expect from a district that is half Bristol commuter belt and half seaside town. The growth rate is the outlier. Every neighbour grew more slowly, the South West as a region fell 0.2% on the year, and Bath and North East Somerset, much the most expensive of them, went backwards at −0.7%.
How fast it turned
The index has monthly figures, and they show a market that went from falling to rising in about eight months, then gave some of it back in July:
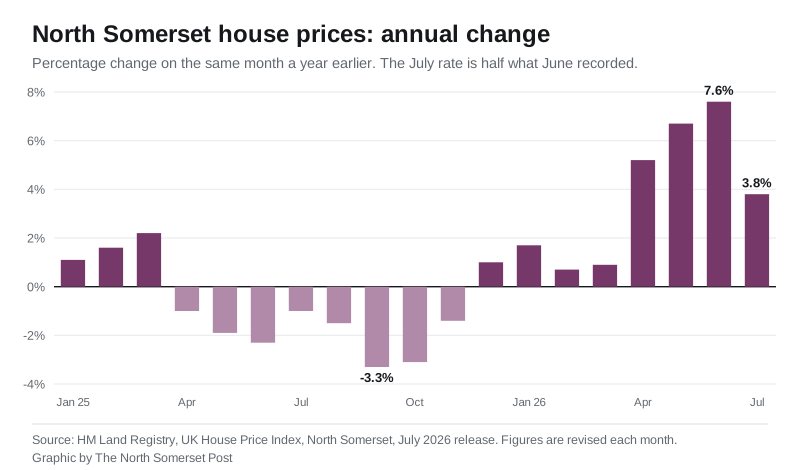
Two caveats on reading that. Local authority figures in this index are volatile, because they are built from a modest number of sales each month and are revised as later sales are registered. June was first published at £314,628 and has since been revised up to £315,000, so July’s figure will move too. And much of the drop in the annual rate is a base effect: July 2025 alone rose 3.2%, so this July had a far harder comparison to beat. The month-on-month change in July 2026 was −0.4%.
Prices by property type
The headline average covers a district where a Portishead harbourside house and a Weston flat are both “a home”. The spread is wide:
- Detached: £537,256, up 3.9%.
- Semi-detached: £341,644, up 5.0%, the fastest-growing type.
- Terraced: £272,829, up 4.7%.
- Flats and maisonettes: £168,970, up 1.1%, and less than a third the price of a detached house.
The gap between a flat and a detached house here is £368,286. Flats are much the weakest segment, and on the index they are still 4.6% below their January 2023 level, which is the same pattern showing up in most towns with a large seaside flat stock.
The index splits buyers as well. A first-time buyer in North Somerset paid an average of £245,432 in July 2026, up 3.9% over the year. A home mover, someone selling one property to buy another, paid £383,616, up 3.8%. That £138,184 gap is the size of the step from a first flat or terrace to a family house in this district.
What homes actually sell for, town by town
The district average is one number for a place that contains both Weston’s Hillside ward and the Bristol commuter villages, so it is worth going a level down. We pulled every residential sale recorded by HM Land Registry in the BS20 to BS49 postcode districts with a completion date between 1 July 2025 and 30 June 2026, then matched each postcode to its actual council area and ward, because several of those outcodes cross the boundary into Somerset and Bath and North East Somerset.
That leaves 3,135 sales of houses and flats inside North Somerset, with a median price paid of £310,000. The index average for June 2026, the last month in that window, was £315,000, so the two measures agree to within about £5,000, which is a good sign that neither is misleading. The index average is a mean, so it sits above the median, as expected.
The gap between the top and the bottom of that chart is £239,500, inside a single council area, and it maps almost exactly onto the district’s two halves:
- Long Ashton (£492,500) and Backwell (£470,000) are the most expensive places in North Somerset, and both are effectively Bristol suburbs with a green belt between them and the city. Sample sizes are small, 67 and 51 sales, so treat them as indicative.
- Portishead (£380,000, from 424 sales) is the largest expensive market and the clearest picture in the data. Its wards split sharply: Portishead West at £445,000 and Portishead East at £410,000 against Portishead South at £330,000.
- Clevedon (£340,000) and Nailsea (£343,500) land in the middle and close together, though Clevedon has the wider internal spread, from Clevedon Walton at £475,000 down to Clevedon Yeo at £308,500.
- Weston-super-Mare (£253,000, from 1,354 sales) is both the cheapest town and by far the busiest market, accounting for 43% of every sale in the district. Its own range runs from Hillside at £185,000 and Central at £195,000 up to Kewstoke at £317,500 and Uphill at £312,000.
By property type across the district, the medians paid were £465,000 detached, £315,000 semi-detached, £267,500 terraced and £175,000 flats. The flat figure is dominated by Weston, where most of the district’s flat stock is.
Two caveats. Sales are counted by the council area the property sits in, so homes in BS24, BS25, BS40 and BS41 that fall outside North Somerset are excluded even though they share a postcode district. And Land Registry data lags: sales completing in the last weeks of the window are still being registered, so recent volumes will rise.
What it means for you
If you are buying, the market moved against you by about £11,500 over the last year, and by more than that on a semi. If you are selling, comparables from early 2025 are now materially out of date, in your favour, but July’s small fall means the run of rises has paused. If you are staying put, your equity is up in cash terms while the wider South West fell 0.2%.
The supply side is worth holding in mind. North Somerset completed a net 794 homes in the year to March 2026 against a Local Plan requirement of 1,580 a year. The Local Plan 2041 proposes 24,495 more, but the plan is still at examination, so none of that supply lands soon.
Frequently asked questions
What is the average house price in North Somerset?
£313,638 in July 2026, according to the UK House Price Index built from HM Land Registry sales. That covers every property type across the whole North Somerset unitary authority. It is a mean average, not a median.
Are North Somerset house prices going up or down?
Up over the year, down slightly on the month. Prices rose 3.8% in the year to July 2026, against 1.1% for England and −0.2% for the South West, but the average fell £1,362 between June and July. A year earlier the district was in negative territory, at −3.3% in the year to September 2025.
How much is a detached house in North Somerset?
An average of £537,256 in July 2026, up 3.9% over the year, and about £195,600 more than the average semi-detached house.
Which is the most expensive part of North Somerset?
By median sold price over the twelve months to June 2026, Long Ashton at £492,500 and Backwell at £470,000, both on the Bristol side of the district. Of the larger towns, Portishead leads at £380,000.
Which is the cheapest part of North Somerset?
Weston-super-Mare, at a median of £253,000, and within it the Hillside ward at £185,000 and Central at £195,000. Weston is also the busiest market in the district, with 43% of all sales.
Is North Somerset more expensive than Bristol?
No. The City of Bristol average was £352,262 in July 2026 against North Somerset’s £313,638. Bath and North East Somerset is dearer still at £409,045.
How much does a first-time buyer pay in North Somerset?
An average of £245,432, up 3.9% over the year. The average home mover paid £383,616.
Where can I check what a specific house sold for?
Every completed sale in England and Wales is public. Look up any street or address free on the HM Land Registry Price Paid service.
Sources
- UK House Price Index, North Somerset, July 2026 (HM Land Registry / ONS) for the district average and the property-type and buyer-type figures.
- UK House Price Index, England and South West, July 2026, and the same release taken authority by authority for the City of Bristol, Bath and North East Somerset, Somerset and the South West ranking.
- HM Land Registry Price Paid Data for the 3,135 individual sales behind the town and ward medians, matched to council areas and wards using postcodes.io.
- Residential Land Survey and Housing Land Supply Position Report, April 2026 for completions.
- HM Land Registry Price Paid search to check any individual address.
Index figures are provisional and revised as more sales complete. Always confirm the latest numbers against the linked sources before making a decision.
Have your say