
July's figure is 3,235 people, 2.5% of working-age residents. Under-25s account for the whole year's rise, and Weston Central's rate is seven times Backwell's.
The number of North Somerset residents on the claimant count reached 3,235 in July, 2.5% of everyone aged 16 to 64. The figure is up 45 on June and up 95 on July last year. (nomis, ONS claimant count, dataset NM_162_1)
Compare it with two years ago and the direction reverses. In July 2024 the district count was 3,440, or 2.6%. North Somerset is 205 claimants below where it was then, and 95 above where it was 12 months ago.
The claimant count is not the same as unemployment. It counts people claiming Jobseeker’s Allowance plus those on Universal Credit who are required to look for work and be available for it, so it includes people who are working but expected to find more hours. (nomis, claimant count source notes)
The whole year’s increase is under-25s
Split the district figure by age and the rise stops looking general.
| Age group | July 2025 | July 2026 | Change |
|---|---|---|---|
| 16 to 24 | 600 | 695 | +95 |
| 25 to 49 | 1,765 | 1,730 | -35 |
| 50 and over | 775 | 810 | +35 |
| All ages | 3,140 | 3,235 | +95 |
Claims from people aged 16 to 24 are up 95 over the year, which is the entire net increase for the district. Claims from 25 to 49-year-olds actually fell by 35 in the same period. The over-50s are up 35.
That matters locally because it is the group about to get bigger. GCSE results are published on Thursday 20 August, and school and college leavers who do not go straight into a course or an apprenticeship show up in this series within a couple of months.
The gap between the two halves of the district
North Somerset’s headline 2.5% hides a spread of more than sevenfold.
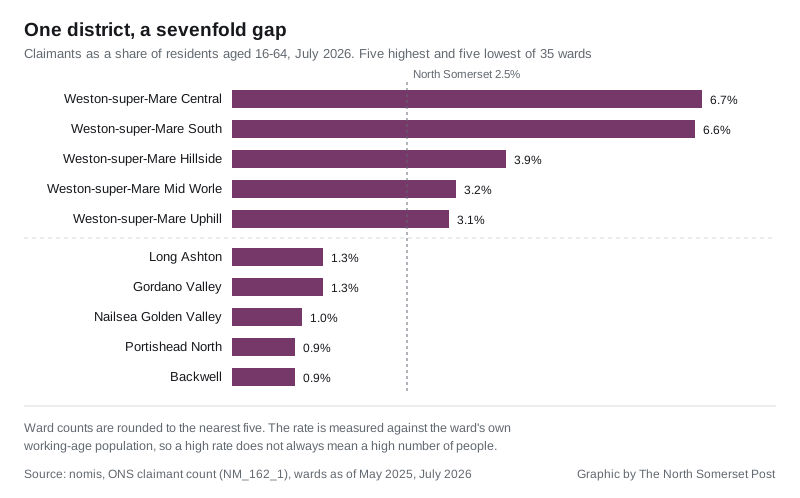
Weston-super-Mare Central is at 6.7% and Weston-super-Mare South at 6.6%. Backwell and Portishead North are both at 0.9%. Between those two ends sit 31 other wards. (nomis, claimant count by ward, July 2026)
The 10 wards named after Weston-super-Mare account for 1,885 of the district’s claimants, 58% of the total, on roughly a third of its wards. Portishead’s four wards between them have 235. Clevedon’s five have 240. Nailsea’s four have 165.
Here is every ward, ranked by rate. The rate is claimants as a share of residents aged 16 to 64, so a small ward with a high rate can have a lower count than a large ward with a low one.
| Ward | Claimants | Rate |
|---|---|---|
| Weston-super-Mare Central | 420 | 6.7% |
| Weston-super-Mare South | 400 | 6.6% |
| Weston-super-Mare Hillside | 220 | 3.9% |
| Weston-super-Mare Mid Worle | 70 | 3.2% |
| Weston-super-Mare Uphill | 155 | 3.1% |
| Clevedon East | 80 | 2.9% |
| Nailsea Yeo | 55 | 2.6% |
| Hutton & Locking | 120 | 2.5% |
| Weston-super-Mare Milton | 145 | 2.5% |
| Clevedon South | 55 | 2.3% |
| Pill | 60 | 2.3% |
| Weston-super-Mare Kewstoke | 110 | 2.3% |
| Nailsea West End | 45 | 2.2% |
| Weston-super-Mare Winterstoke | 145 | 2.1% |
| Nailsea Youngwood | 40 | 2.0% |
| Weston-super-Mare North Worle | 105 | 2.0% |
| Weston-super-Mare South Worle | 115 | 2.0% |
| Banwell & Winscombe | 100 | 1.9% |
| Congresbury & Puxton | 40 | 1.8% |
| Clevedon Walton | 40 | 1.7% |
| Portishead East | 95 | 1.7% |
| Wick St Lawrence & St Georges | 50 | 1.7% |
| Winford | 45 | 1.7% |
| Yatton | 95 | 1.7% |
| Portishead South | 35 | 1.6% |
| Portishead West | 80 | 1.6% |
| Wrington | 40 | 1.6% |
| Clevedon West | 30 | 1.5% |
| Blagdon & Churchill | 35 | 1.4% |
| Clevedon Yeo | 35 | 1.4% |
| Gordano Valley | 30 | 1.3% |
| Long Ashton | 65 | 1.3% |
| Nailsea Golden Valley | 25 | 1.0% |
| Backwell | 25 | 0.9% |
| Portishead North | 25 | 0.9% |
Ward counts are rounded to the nearest five and sum to 3,230 against the district’s 3,235, which is the rounding rather than a missing ward. The ward series has no back run, so there is no like-for-like ward comparison with last July.
How North Somerset sits against its neighbours
All of these are the same measure for the same month, claimants as a proportion of residents aged 16 to 64 in July 2026.
| Area | Rate |
|---|---|
| Bath and North East Somerset | 1.9% |
| South Gloucestershire | 2.0% |
| North Somerset | 2.5% |
| Somerset | 2.6% |
| South West | 2.7% |
| Bristol, City of | 3.6% |
| United Kingdom | 3.9% |
North Somerset is below the regional and national rates and above both of the other former Avon districts outside Bristol. Weston-super-Mare Central on its own, at 6.7%, is nearly twice the UK rate.
The national picture, separately
The ONS published its monthly labour market overview on the same day, 18 August. It put the UK unemployment rate at 4.9% for April to June 2026, said vacancies fell by 6,000 (0.8%) to 707,000 in the May to July period, and said payrolled employees across the UK fell by 78,000 (0.3%) between June 2025 and June 2026. The next release is on 15 September. (ONS, Labour market overview, UK: August 2026)
One caution on reading those two things together. The bulletin’s national claimant figure comes from a different, seasonally adjusted series than the local one used above, and this month the two point in opposite directions. That is why every comparison in this piece is drawn from the same nomis table rather than set against the bulletin’s headline.
What it means for you
If you are claiming, or about to, Universal Credit claims and changes are made at gov.uk/universal-credit. Your work coach is based at a named Jobcentre, and DWP’s own office finder will tell you which one covers your postcode. (gov.uk, contact Jobcentre Plus)
If you are 16 to 18 and this week’s GCSE results are not what you needed, leaving education altogether is not one of the options. In England you must either stay in full-time education, start an apprenticeship, or spend 20 hours or more a week working or volunteering while in part-time education or training. (gov.uk, when you can leave school) The National Careers Service advice line is free on 0800 100 900, 8am to 8pm Monday to Friday and 10am to 5pm on Saturdays, and gov.uk/apply-apprenticeship lists vacancies by postcode.
If you are comparing towns before a move, the ward table above is a fairer guide than the district average, and it is worth reading alongside our page on North Somerset house prices. The wards with the lowest claimant rates are also the district’s most expensive.
The next monthly figure, for August 2026, is due on 15 September.
Have your say