
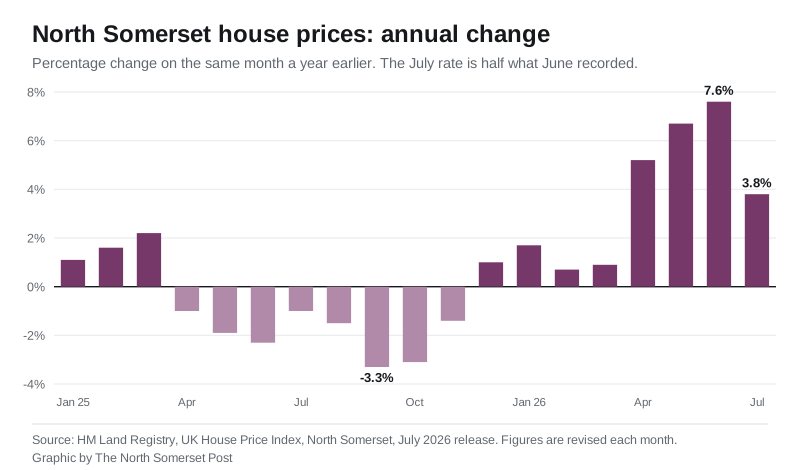
The average fell £1,362 in July to £313,638, the first monthly drop since February, and annual growth halved from 7.6% to 3.8%. Flats are still below 2023.
The average North Somerset home was worth £313,638 in July, £1,362 less than in June. It is the first monthly fall since February, and it comes with a much bigger change underneath it: the annual growth rate has halved.
Prices here were rising 7.6% a year in June, the fastest of any local authority in the South West. In July that dropped to 3.8%, which is £11,492 more than a year earlier (HM Land Registry).
North Somerset is still doing better than almost everywhere around it. The South West as a region fell 0.2% on the year. England rose 1.1%.
Published 19 September 2026. Figures are the July 2026 UK House Price Index release.
Why the rate halved without prices really falling
The annual figure compares July with July. It says as much about last year as this year.
July 2025 was an unusually strong month in North Somerset. The average jumped 3.2% in that one month, from £292,809 in June 2025 to £302,146 in July. That is the number this year’s figure is measured against, so the comparison got much harder overnight.
The month-on-month fall is real but small, at 0.4%. Both things are true: prices edged down in July, and the headline growth rate fell for a reason that has little to do with July 2026.
Where North Somerset sits in the South West
Of the 26 South West local authority areas with a July figure, North Somerset had the second-fastest annual growth. Only Gloucester, at 4.9%, was ahead. In June, North Somerset was first.
Its immediate neighbours:
- Bath and North East Somerset: £409,045, down 0.7% on the year
- City of Bristol: £352,262, up 2.1%
- South Gloucestershire: £341,833, up 3.4%
- Somerset: £282,062, up 3.1%
- England: £293,479, up 1.1%
- South West: £302,298, down 0.2%
North Somerset remains more expensive than the England average and than the South West as a whole, a position it only reached this summer.
The longer view: three and a half years of almost nothing
The index is set so that January 2023 equals 100. North Somerset’s July reading is 100.3.
In cash, the average was £312,548 in January 2023 and £313,638 in July 2026. That is a gain of £1,090 in three and a half years, before you count inflation.
Flats have done worse than that. The flat and maisonette index is 95.4, so flats are 4.6% below their January 2023 level. The average flat was £177,097 then and £168,970 now, £8,127 less.
By property type
| Type | Average | Year | Month |
|---|---|---|---|
| Detached | £537,256 | +3.9% | -0.5% |
| Semi-detached | £341,644 | +5.0% | -0.5% |
| Terraced | £272,829 | +4.7% | -0.2% |
| Flat or maisonette | £168,970 | +1.1% | -0.6% |
Every type fell on the month. Semi-detached homes remain the fastest risers over the year, as they were in June. Flats are the weakest on both measures.
A first-time buyer paid an average of £245,432, up 3.9% on the year. A home mover paid £383,616, up 3.8%.
What it means for you
- A single month is not a trend. One 0.4% fall after five rises is not a turning point, and these figures get revised.
- They do get revised, and we have to correct ourselves. In August we reported June’s average as £314,628 and its annual rise as 7.5%. Land Registry has since revised June up to £315,000 and 7.6%. Our North Somerset house prices page has been updated to July throughout.
- This is a mean, not a median. UKHPI averages every sale, so a handful of expensive houses pull it up. It is also a district-wide figure covering Portishead and Winscombe as well as central Weston, and those markets do not behave alike.
- The sales count is thin and lags. The most recent month Land Registry has published a volume for is May 2026, at 222 sales across the whole district. June and July are still blank.
- If you own a flat, the picture is different from the headline. Flats have not recovered their January 2023 value and rose just 1.1% over the year.
Sources
- HM Land Registry, UK House Price Index: North Somerset, July 2026 release
- HM Land Registry, UK House Price Index: England
- Comparator figures for the South West authorities are from the same UKHPI release, taken authority by authority
Have your say