
The average home hit £314,628 in June, up £21,819 in a year, while neighbouring Bath and North East Somerset fell. Only 24 English districts rose faster.
The average North Somerset home was worth £314,628 in June 2026, up 7.5% on a year earlier. That is a gain of £21,819 in twelve months, and it is the fastest rise of any local authority area in the South West.
It is also a reversal. In June 2025 prices in the district were falling by 2.3%.
The figures come from the UK House Price Index published by HM Land Registry, released this week. Across the 295 local authority districts in England, North Somerset ranks 25th for annual growth. Sixty-two of those districts saw prices fall.
Faster than anywhere else nearby
North Somerset is not just ahead of the national picture. It is well ahead of every authority it borders.
| Area | Average price | Annual change |
|---|---|---|
| North Somerset | £314,628 | +7.5% |
| Somerset | £281,571 | +4.5% |
| City of Bristol | £356,824 | +3.5% |
| South Gloucestershire | £340,300 | +2.3% |
| Bath and North East Somerset | £404,480 | -0.1% |
| South West | £304,562 | +1.9% |
| England | £293,262 | +1.8% |
North Somerset is rising more than four times as fast as England as a whole. Bath and North East Somerset, the most expensive of the group, went backwards over the same year.
One consequence is that the district has crossed a line. At £314,628 the average North Somerset home now costs more than the England average of £293,262, and more than the South West average of £304,562. Two years ago that was not true.
The turn happened in spring
The recovery is recent and it was quick.
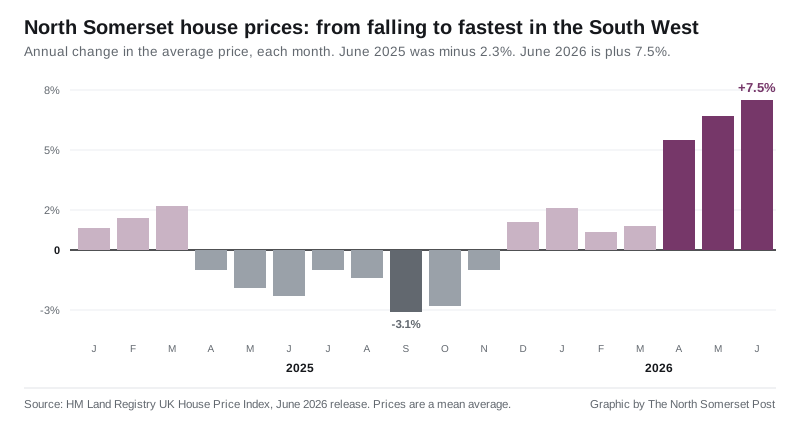
Prices in the district were falling for most of 2025. The low point was September 2025, at minus 3.1%. The annual figure did not turn positive again until December. It then sat between 0.9% and 2.1% through the winter before jumping to 5.5% in April, 6.7% in May and 7.5% in June.
Semi-detached houses moved most
The rise was not even across the market. The family-housing end moved hardest, and flats lagged well behind.
| Type | June 2026 | Year change |
|---|---|---|
| Detached | £539,385 | +7.1% (+£35,807) |
| Semi-detached | £342,718 | +8.6% (+£27,265) |
| Terraced | £272,488 | +8.4% (+£21,017) |
| Flat | £170,087 | +5.4% (+£8,787) |
A first-time buyer in North Somerset now faces an average of £246,318, up 7.8%, or £17,768 more than a year ago.
What it means for you
If you are buying. The deposit you were saving for a year ago no longer covers the same share of the price. On the first-time buyer average, a 10% deposit has gone up by roughly £1,800 in twelve months, and a 15% deposit by roughly £2,700. Semi-detached and terraced homes, the stock most first and second-time buyers look at, rose faster than the district average.
If you are selling. You are selling into the strongest twelve months the district has had since before 2025. Be careful about reading the headline figure as your own gain: it is a district-wide mean, and it says nothing about your street.
If you are staying put. The figure matters mainly for remortgaging, where a higher valuation can move you into a better loan-to-value band.
Three things to know about the number itself.
- It is a mean average, not a median. A small number of expensive sales pull it upwards, so more than half of homes sold for less than £314,628.
- It gets revised. May 2026 was first published at £312,303 and has since been revised up to £313,165. June’s £314,628 will move too.
- It covers the whole district. North Somerset contains both Weston-super-Mare and the Bristol commuter towns of Portishead, Clevedon and Nailsea, which are very different markets. The Land Registry does not publish a separate index for each town, so a single district average is all this release supports.
Sales volumes are not yet published for May or June. The most recent month with a count is April 2026, at 209 sales, and Land Registry figures for recent months are always incomplete until later registrations come in.
We keep a fuller breakdown, including how the district compares over a longer run, on our North Somerset house prices page. For what is being built and where, see North Somerset planning news.
Sources
- HM Land Registry UK House Price Index, North Somerset, June 2026 release, for the district average, annual change, property type splits and first-time buyer figure.
- UK HPI full file, June 2026, for the England, South West and neighbouring authority comparisons and the ranking of all 295 English local authority districts.
- UK House Price Index browser to check the series yourself.
Have your say